|
Download Data (XLS File) |
|
|||||
|
|||||
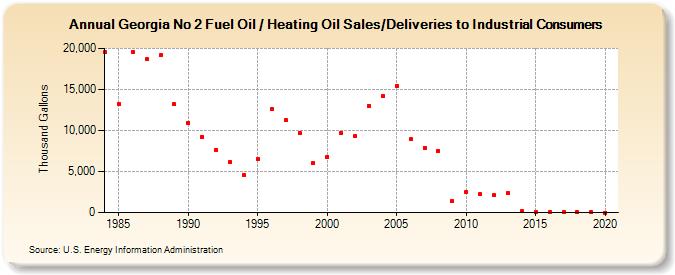
| Georgia No 2 Fuel Oil / Heating Oil Sales/Deliveries to Industrial Consumers (Thousand Gallons) | |||||
| Decade | Year-0 | Year-1 | Year-2 | Year-3 | Year-4 | Year-5 | Year-6 | Year-7 | Year-8 | Year-9 |
|---|---|---|---|---|---|---|---|---|---|---|
| 1980's | 19,557 | 13,246 | 19,619 | 18,666 | 19,150 | 13,183 | ||||
| 1990's | 10,893 | 9,236 | 7,658 | 6,189 | 4,554 | 6,529 | 12,584 | 11,219 | 9,697 | 6,019 |
| 2000's | 6,778 | 9,716 | 9,320 | 13,017 | 14,144 | 15,475 | 8,924 | 7,866 | 7,485 | 1,400 |
| 2010's | 2,531 | 2,252 | 2,101 | 2,396 | 150 | 117 | 125 | 64 | 26 | 33 |
| 2020's | 0 |
| - = No Data Reported; -- = Not Applicable; NA = Not Available; W = Withheld to avoid disclosure of individual company data. |
| Release Date: 2/9/2022 |
| Next Release Date: Suspended |