|
Download Data (XLS File) |
|
|||||
|
|||||
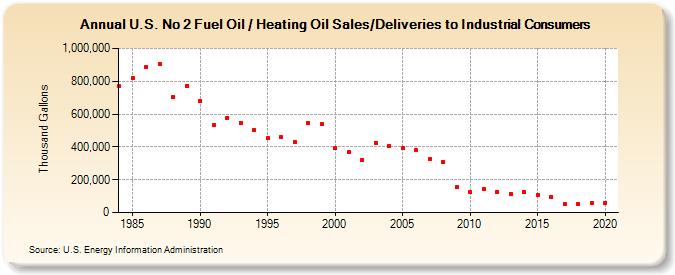
| U.S. No 2 Fuel Oil / Heating Oil Sales/Deliveries to Industrial Consumers (Thousand Gallons) | |||||
| Decade | Year-0 | Year-1 | Year-2 | Year-3 | Year-4 | Year-5 | Year-6 | Year-7 | Year-8 | Year-9 |
|---|---|---|---|---|---|---|---|---|---|---|
| 1980's | 772,356 | 820,484 | 887,788 | 904,134 | 704,139 | 772,239 | ||||
| 1990's | 682,217 | 531,994 | 575,731 | 548,536 | 504,113 | 452,442 | 457,744 | 432,296 | 548,068 | 537,988 |
| 2000's | 391,579 | 367,267 | 322,541 | 425,484 | 406,270 | 391,574 | 378,321 | 324,891 | 310,685 | 154,750 |
| 2010's | 122,870 | 143,117 | 125,447 | 116,055 | 126,038 | 109,134 | 94,783 | 53,135 | 54,135 | 60,775 |
| 2020's | 60,032 |
| - = No Data Reported; -- = Not Applicable; NA = Not Available; W = Withheld to avoid disclosure of individual company data. |
| Release Date: 2/9/2022 |
| Next Release Date: Suspended |