|
Download Data (XLS File) |
|
|||||
|
|||||
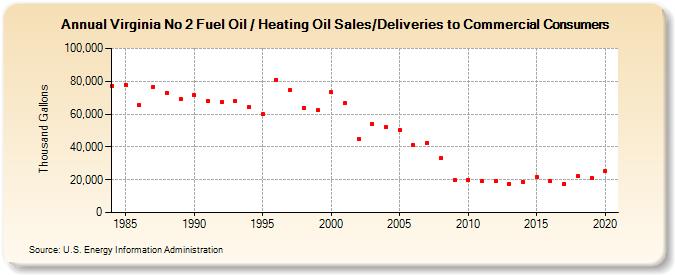
| Virginia No 2 Fuel Oil / Heating Oil Sales/Deliveries to Commercial Consumers (Thousand Gallons) | |||||
| Decade | Year-0 | Year-1 | Year-2 | Year-3 | Year-4 | Year-5 | Year-6 | Year-7 | Year-8 | Year-9 |
|---|---|---|---|---|---|---|---|---|---|---|
| 1980's | 77,312 | 77,882 | 65,511 | 76,762 | 73,094 | 69,314 | ||||
| 1990's | 71,319 | 68,219 | 67,361 | 67,858 | 64,078 | 59,820 | 80,973 | 74,710 | 63,851 | 62,305 |
| 2000's | 73,268 | 66,466 | 45,053 | 54,010 | 51,992 | 50,409 | 41,100 | 42,527 | 33,215 | 19,927 |
| 2010's | 19,902 | 19,219 | 19,274 | 17,688 | 18,686 | 21,835 | 18,953 | 17,423 | 22,169 | 21,173 |
| 2020's | 25,055 |
| - = No Data Reported; -- = Not Applicable; NA = Not Available; W = Withheld to avoid disclosure of individual company data. |
| Release Date: 2/9/2022 |
| Next Release Date: Suspended |