|
Download Data (XLS File) |
|
|||||
|
|||||
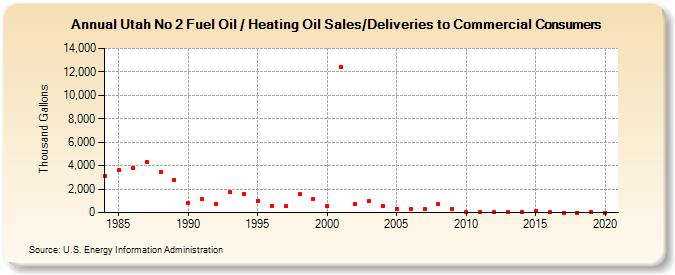
| Utah No 2 Fuel Oil / Heating Oil Sales/Deliveries to Commercial Consumers (Thousand Gallons) | |||||
| Decade | Year-0 | Year-1 | Year-2 | Year-3 | Year-4 | Year-5 | Year-6 | Year-7 | Year-8 | Year-9 |
|---|---|---|---|---|---|---|---|---|---|---|
| 1980's | 3,141 | 3,607 | 3,782 | 4,340 | 3,422 | 2,818 | ||||
| 1990's | 783 | 1,145 | 739 | 1,733 | 1,584 | 997 | 589 | 518 | 1,547 | 1,147 |
| 2000's | 593 | 12,390 | 738 | 955 | 557 | 331 | 330 | 294 | 721 | 337 |
| 2010's | 62 | 63 | 49 | 76 | 33 | 152 | 25 | 1 | 1 | 27 |
| 2020's | 2 |
| - = No Data Reported; -- = Not Applicable; NA = Not Available; W = Withheld to avoid disclosure of individual company data. |
| Release Date: 2/9/2022 |
| Next Release Date: Suspended |