|
Download Data (XLS File) |
|
|||||
|
|||||
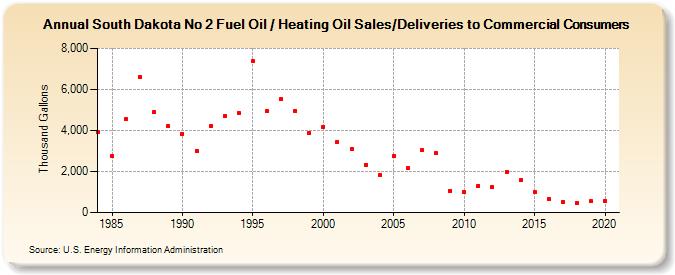
| South Dakota No 2 Fuel Oil / Heating Oil Sales/Deliveries to Commercial Consumers (Thousand Gallons) | |||||
| Decade | Year-0 | Year-1 | Year-2 | Year-3 | Year-4 | Year-5 | Year-6 | Year-7 | Year-8 | Year-9 |
|---|---|---|---|---|---|---|---|---|---|---|
| 1980's | 3,911 | 2,749 | 4,543 | 6,606 | 4,904 | 4,203 | ||||
| 1990's | 3,841 | 3,017 | 4,194 | 4,705 | 4,860 | 7,384 | 4,935 | 5,512 | 4,969 | 3,885 |
| 2000's | 4,192 | 3,432 | 3,112 | 2,341 | 1,819 | 2,765 | 2,152 | 3,046 | 2,880 | 1,073 |
| 2010's | 1,014 | 1,312 | 1,234 | 1,987 | 1,563 | 994 | 682 | 503 | 472 | 550 |
| 2020's | 585 |
| - = No Data Reported; -- = Not Applicable; NA = Not Available; W = Withheld to avoid disclosure of individual company data. |
| Release Date: 2/9/2022 |
| Next Release Date: Suspended |