|
Download Data (XLS File) |
|
|||||
|
|||||
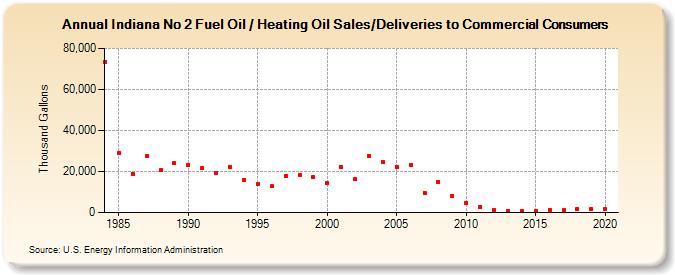
| Indiana No 2 Fuel Oil / Heating Oil Sales/Deliveries to Commercial Consumers (Thousand Gallons) | |||||
| Decade | Year-0 | Year-1 | Year-2 | Year-3 | Year-4 | Year-5 | Year-6 | Year-7 | Year-8 | Year-9 |
|---|---|---|---|---|---|---|---|---|---|---|
| 1980's | 73,467 | 29,129 | 18,880 | 27,608 | 20,712 | 24,132 | ||||
| 1990's | 23,135 | 21,634 | 19,346 | 22,436 | 16,110 | 14,085 | 12,877 | 18,018 | 18,111 | 17,314 |
| 2000's | 14,496 | 22,199 | 16,306 | 27,677 | 24,752 | 22,445 | 23,172 | 9,653 | 15,013 | 8,212 |
| 2010's | 4,853 | 2,781 | 1,431 | 772 | 810 | 774 | 1,044 | 1,100 | 1,687 | 1,727 |
| 2020's | 1,544 |
| - = No Data Reported; -- = Not Applicable; NA = Not Available; W = Withheld to avoid disclosure of individual company data. |
| Release Date: 2/9/2022 |
| Next Release Date: Suspended |