|
Download Data (XLS File) |
|
|||||
|
|||||
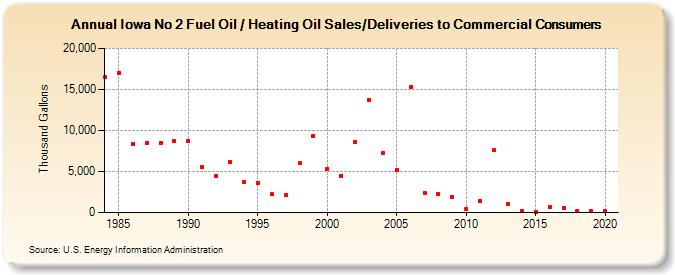
| Iowa No 2 Fuel Oil / Heating Oil Sales/Deliveries to Commercial Consumers (Thousand Gallons) | |||||
| Decade | Year-0 | Year-1 | Year-2 | Year-3 | Year-4 | Year-5 | Year-6 | Year-7 | Year-8 | Year-9 |
|---|---|---|---|---|---|---|---|---|---|---|
| 1980's | 16,528 | 17,001 | 8,319 | 8,516 | 8,475 | 8,665 | ||||
| 1990's | 8,701 | 5,540 | 4,491 | 6,186 | 3,757 | 3,636 | 2,224 | 2,192 | 5,983 | 9,370 |
| 2000's | 5,348 | 4,469 | 8,558 | 13,722 | 7,226 | 5,236 | 15,276 | 2,415 | 2,275 | 1,892 |
| 2010's | 482 | 1,448 | 7,616 | 1,044 | 222 | 119 | 724 | 567 | 168 | 138 |
| 2020's | 148 |
| - = No Data Reported; -- = Not Applicable; NA = Not Available; W = Withheld to avoid disclosure of individual company data. |
| Release Date: 2/9/2022 |
| Next Release Date: Suspended |