|
Download Data (XLS File) |
|
|||||
|
|||||
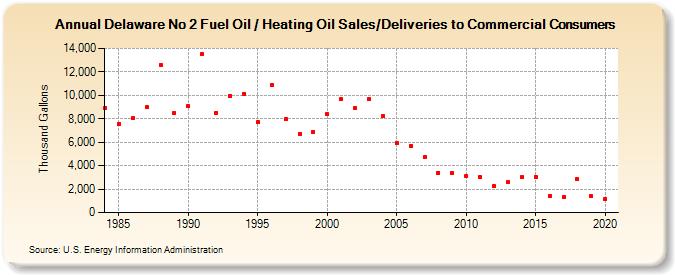
| Delaware No 2 Fuel Oil / Heating Oil Sales/Deliveries to Commercial Consumers (Thousand Gallons) | |||||
| Decade | Year-0 | Year-1 | Year-2 | Year-3 | Year-4 | Year-5 | Year-6 | Year-7 | Year-8 | Year-9 |
|---|---|---|---|---|---|---|---|---|---|---|
| 1980's | 8,921 | 7,563 | 8,042 | 8,986 | 12,614 | 8,501 | ||||
| 1990's | 9,069 | 13,550 | 8,527 | 9,977 | 10,153 | 7,719 | 10,895 | 7,947 | 6,737 | 6,859 |
| 2000's | 8,393 | 9,670 | 8,880 | 9,644 | 8,215 | 5,933 | 5,700 | 4,703 | 3,404 | 3,386 |
| 2010's | 3,080 | 3,015 | 2,235 | 2,568 | 3,021 | 3,034 | 1,448 | 1,344 | 2,827 | 1,383 |
| 2020's | 1,175 |
| - = No Data Reported; -- = Not Applicable; NA = Not Available; W = Withheld to avoid disclosure of individual company data. |
| Release Date: 2/9/2022 |
| Next Release Date: Suspended |