|
Download Data (XLS File) |
|
|||||
|
|||||
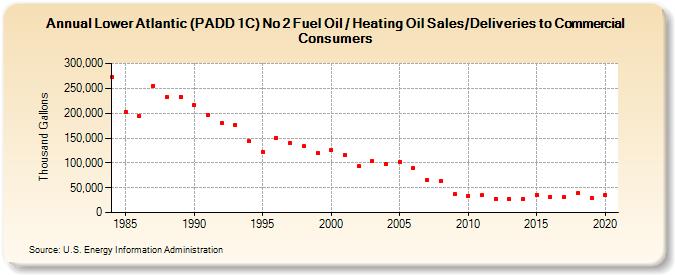
| Lower Atlantic (PADD 1C) No 2 Fuel Oil / Heating Oil Sales/Deliveries to Commercial Consumers (Thousand Gallons) | |||||
| Decade | Year-0 | Year-1 | Year-2 | Year-3 | Year-4 | Year-5 | Year-6 | Year-7 | Year-8 | Year-9 |
|---|---|---|---|---|---|---|---|---|---|---|
| 1980's | 273,342 | 202,043 | 193,972 | 255,675 | 232,415 | 233,335 | ||||
| 1990's | 216,552 | 196,957 | 180,682 | 176,521 | 143,370 | 122,490 | 150,181 | 139,737 | 133,426 | 120,147 |
| 2000's | 125,559 | 115,693 | 93,418 | 103,621 | 97,434 | 102,361 | 89,664 | 66,505 | 63,310 | 36,434 |
| 2010's | 33,641 | 34,661 | 27,821 | 27,421 | 27,606 | 36,262 | 31,572 | 31,076 | 38,661 | 30,118 |
| 2020's | 35,753 |
| - = No Data Reported; -- = Not Applicable; NA = Not Available; W = Withheld to avoid disclosure of individual company data. |
| Release Date: 2/9/2022 |
| Next Release Date: Suspended |