|
Download Data (XLS File) |
|
|||||
|
|||||
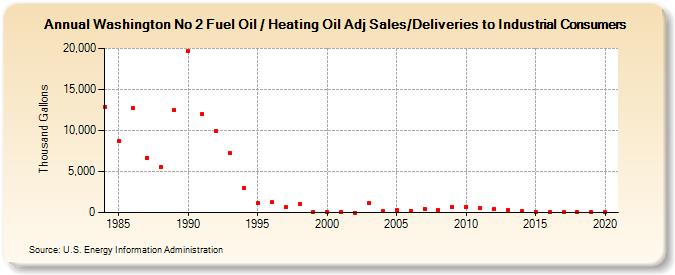
| Washington No 2 Fuel Oil / Heating Oil Adj Sales/Deliveries to Industrial Consumers (Thousand Gallons) | |||||
| Decade | Year-0 | Year-1 | Year-2 | Year-3 | Year-4 | Year-5 | Year-6 | Year-7 | Year-8 | Year-9 |
|---|---|---|---|---|---|---|---|---|---|---|
| 1980's | 12,914 | 8,687 | 12,716 | 6,693 | 5,561 | 12,513 | ||||
| 1990's | 19,643 | 12,027 | 9,961 | 7,247 | 2,983 | 1,120 | 1,237 | 626 | 995 | 115 |
| 2000's | 105 | 98 | 0 | 1,104 | 158 | 315 | 160 | 476 | 256 | 720 |
| 2010's | 707 | 540 | 444 | 304 | 131 | 129 | 35 | 16 | 16 | 13 |
| 2020's | 23 |
| - = No Data Reported; -- = Not Applicable; NA = Not Available; W = Withheld to avoid disclosure of individual company data. |
| Release Date: 2/9/2022 |
| Next Release Date: Suspended |