|
Download Data (XLS File) |
|
|||||
|
|||||
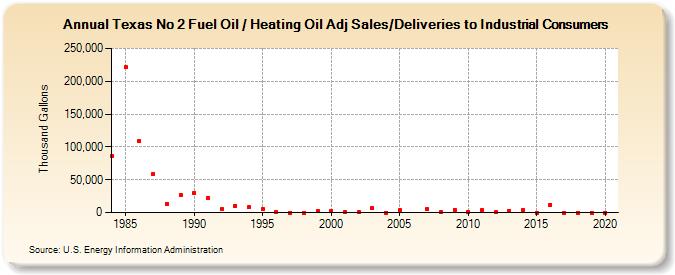
| Texas No 2 Fuel Oil / Heating Oil Adj Sales/Deliveries to Industrial Consumers (Thousand Gallons) | |||||
| Decade | Year-0 | Year-1 | Year-2 | Year-3 | Year-4 | Year-5 | Year-6 | Year-7 | Year-8 | Year-9 |
|---|---|---|---|---|---|---|---|---|---|---|
| 1980's | 85,444 | 221,264 | 108,762 | 58,726 | 13,654 | 27,427 | ||||
| 1990's | 29,829 | 22,513 | 5,672 | 10,424 | 7,821 | 5,156 | 1,198 | 0 | 16 | 2,751 |
| 2000's | 1,996 | 1,587 | 146 | 6,890 | 90 | 3,392 | -- | 5,335 | 1,074 | 4,325 |
| 2010's | 578 | 3,929 | 465 | 3,067 | 4,219 | 0 | 11,973 | 0 | 0 | 0 |
| 2020's | 0 |
| - = No Data Reported; -- = Not Applicable; NA = Not Available; W = Withheld to avoid disclosure of individual company data. |
| Release Date: 2/9/2022 |
| Next Release Date: Suspended |