|
Download Data (XLS File) |
|
|||||
|
|||||
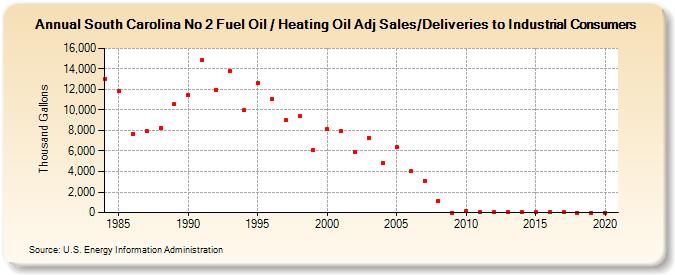
| South Carolina No 2 Fuel Oil / Heating Oil Adj Sales/Deliveries to Industrial Consumers (Thousand Gallons) | |||||
| Decade | Year-0 | Year-1 | Year-2 | Year-3 | Year-4 | Year-5 | Year-6 | Year-7 | Year-8 | Year-9 |
|---|---|---|---|---|---|---|---|---|---|---|
| 1980's | 13,055 | 11,811 | 7,639 | 7,947 | 8,222 | 10,562 | ||||
| 1990's | 11,425 | 14,836 | 11,990 | 13,782 | 9,971 | 12,606 | 11,037 | 9,023 | 9,378 | 6,056 |
| 2000's | 8,112 | 7,964 | 5,870 | 7,302 | 4,783 | 6,355 | 4,015 | 3,094 | 1,174 | 5 |
| 2010's | 159 | 23 | 27 | 17 | 15 | 37 | 26 | 26 | 0 | 1 |
| 2020's | 0 |
| - = No Data Reported; -- = Not Applicable; NA = Not Available; W = Withheld to avoid disclosure of individual company data. |
| Release Date: 2/9/2022 |
| Next Release Date: Suspended |