|
Download Data (XLS File) |
|
|||||
|
|||||
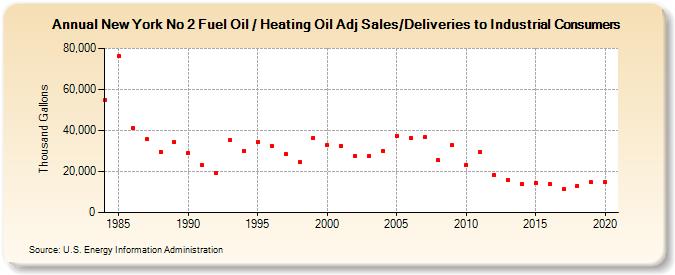
| New York No 2 Fuel Oil / Heating Oil Adj Sales/Deliveries to Industrial Consumers (Thousand Gallons) | |||||
| Decade | Year-0 | Year-1 | Year-2 | Year-3 | Year-4 | Year-5 | Year-6 | Year-7 | Year-8 | Year-9 |
|---|---|---|---|---|---|---|---|---|---|---|
| 1980's | 54,640 | 76,061 | 41,026 | 35,615 | 29,641 | 34,482 | ||||
| 1990's | 28,814 | 23,160 | 19,349 | 35,207 | 30,223 | 34,544 | 32,643 | 28,437 | 24,502 | 36,462 |
| 2000's | 32,791 | 32,356 | 27,458 | 27,355 | 30,093 | 37,398 | 36,547 | 36,662 | 25,374 | 32,740 |
| 2010's | 23,186 | 29,497 | 18,289 | 15,974 | 14,065 | 14,600 | 13,942 | 11,254 | 13,056 | 14,664 |
| 2020's | 14,731 |
| - = No Data Reported; -- = Not Applicable; NA = Not Available; W = Withheld to avoid disclosure of individual company data. |
| Release Date: 2/9/2022 |
| Next Release Date: Suspended |