|
Download Data (XLS File) |
|
|||||
|
|||||
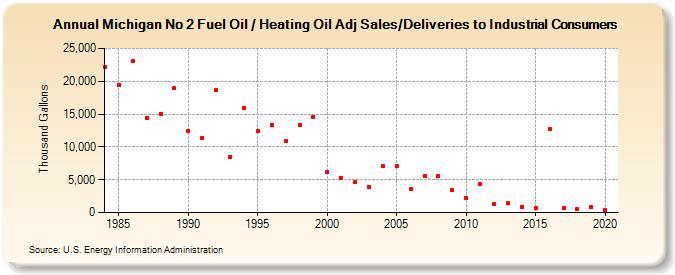
| Michigan No 2 Fuel Oil / Heating Oil Adj Sales/Deliveries to Industrial Consumers (Thousand Gallons) | |||||
| Decade | Year-0 | Year-1 | Year-2 | Year-3 | Year-4 | Year-5 | Year-6 | Year-7 | Year-8 | Year-9 |
|---|---|---|---|---|---|---|---|---|---|---|
| 1980's | 22,119 | 19,478 | 23,013 | 14,468 | 15,066 | 18,938 | ||||
| 1990's | 12,484 | 11,392 | 18,636 | 8,504 | 15,962 | 12,379 | 13,384 | 10,829 | 13,384 | 14,592 |
| 2000's | 6,206 | 5,270 | 4,684 | 3,823 | 7,036 | 7,100 | 3,595 | 5,532 | 5,563 | 3,480 |
| 2010's | 2,207 | 4,350 | 1,342 | 1,430 | 909 | 718 | 12,747 | 756 | 502 | 804 |
| 2020's | 398 |
| - = No Data Reported; -- = Not Applicable; NA = Not Available; W = Withheld to avoid disclosure of individual company data. |
| Release Date: 2/9/2022 |
| Next Release Date: Suspended |