|
Download Data (XLS File) |
|
|||||
|
|||||
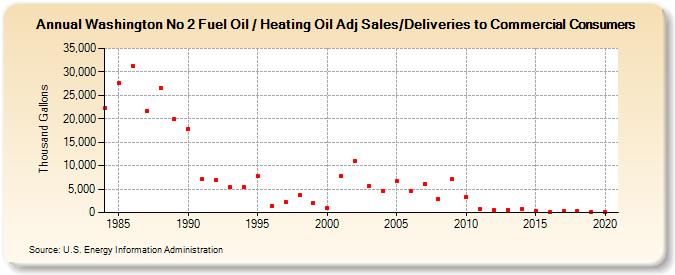
| Washington No 2 Fuel Oil / Heating Oil Adj Sales/Deliveries to Commercial Consumers (Thousand Gallons) | |||||
| Decade | Year-0 | Year-1 | Year-2 | Year-3 | Year-4 | Year-5 | Year-6 | Year-7 | Year-8 | Year-9 |
|---|---|---|---|---|---|---|---|---|---|---|
| 1980's | 22,186 | 27,574 | 31,263 | 21,754 | 26,648 | 19,852 | ||||
| 1990's | 17,877 | 7,092 | 6,868 | 5,344 | 5,421 | 7,823 | 1,422 | 2,215 | 3,755 | 2,074 |
| 2000's | 1,020 | 7,868 | 11,041 | 5,707 | 4,630 | 6,661 | 4,623 | 6,086 | 2,919 | 7,146 |
| 2010's | 3,277 | 769 | 471 | 442 | 795 | 245 | 192 | 254 | 329 | 205 |
| 2020's | 176 |
| - = No Data Reported; -- = Not Applicable; NA = Not Available; W = Withheld to avoid disclosure of individual company data. |
| Release Date: 2/9/2022 |
| Next Release Date: Suspended |