|
Download Data (XLS File) |
|
|||||
|
|||||
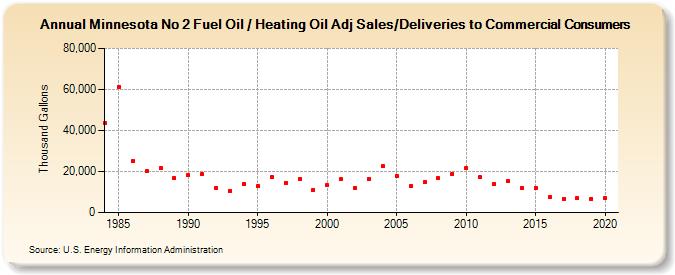
| Minnesota No 2 Fuel Oil / Heating Oil Adj Sales/Deliveries to Commercial Consumers (Thousand Gallons) | |||||
| Decade | Year-0 | Year-1 | Year-2 | Year-3 | Year-4 | Year-5 | Year-6 | Year-7 | Year-8 | Year-9 |
|---|---|---|---|---|---|---|---|---|---|---|
| 1980's | 43,514 | 61,385 | 25,169 | 20,057 | 21,603 | 16,749 | ||||
| 1990's | 18,326 | 18,636 | 12,198 | 10,671 | 14,015 | 12,908 | 17,323 | 14,570 | 16,491 | 11,049 |
| 2000's | 13,275 | 16,169 | 11,984 | 16,508 | 22,484 | 17,853 | 12,773 | 14,804 | 16,639 | 19,030 |
| 2010's | 21,744 | 17,140 | 14,098 | 15,334 | 12,191 | 12,042 | 7,487 | 6,742 | 6,919 | 6,759 |
| 2020's | 6,915 |
| - = No Data Reported; -- = Not Applicable; NA = Not Available; W = Withheld to avoid disclosure of individual company data. |
| Release Date: 2/9/2022 |
| Next Release Date: Suspended |