|
Download Data (XLS File) |
|
|||||
|
|||||
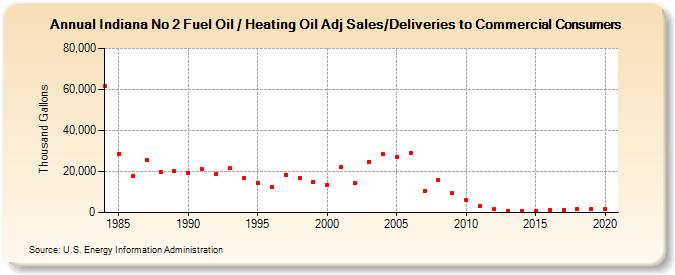
| Indiana No 2 Fuel Oil / Heating Oil Adj Sales/Deliveries to Commercial Consumers (Thousand Gallons) | |||||
| Decade | Year-0 | Year-1 | Year-2 | Year-3 | Year-4 | Year-5 | Year-6 | Year-7 | Year-8 | Year-9 |
|---|---|---|---|---|---|---|---|---|---|---|
| 1980's | 61,754 | 28,660 | 17,744 | 25,549 | 19,807 | 20,029 | ||||
| 1990's | 19,250 | 21,464 | 18,896 | 21,529 | 16,902 | 14,491 | 12,621 | 18,422 | 17,045 | 14,927 |
| 2000's | 13,535 | 22,143 | 14,534 | 24,715 | 28,347 | 27,095 | 29,032 | 10,617 | 15,941 | 9,346 |
| 2010's | 5,985 | 3,147 | 1,679 | 860 | 911 | 821 | 1,046 | 1,119 | 1,859 | 1,884 |
| 2020's | 1,704 |
| - = No Data Reported; -- = Not Applicable; NA = Not Available; W = Withheld to avoid disclosure of individual company data. |
| Release Date: 2/9/2022 |
| Next Release Date: Suspended |