|
Download Data (XLS File) |
|
|||||
|
|||||
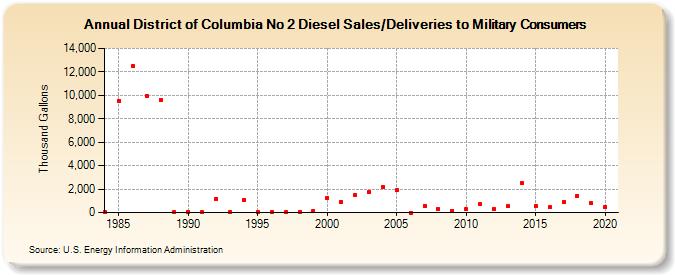
| District of Columbia No 2 Diesel Sales/Deliveries to Military Consumers (Thousand Gallons) | |||||
| Decade | Year-0 | Year-1 | Year-2 | Year-3 | Year-4 | Year-5 | Year-6 | Year-7 | Year-8 | Year-9 |
|---|---|---|---|---|---|---|---|---|---|---|
| 1980's | 6 | 9,545 | 12,476 | 9,952 | 9,638 | 8 | ||||
| 1990's | 50 | 13 | 1,198 | 87 | 1,107 | 15 | 74 | 60 | 90 | 134 |
| 2000's | 1,261 | 940 | 1,516 | 1,750 | 2,198 | 1,914 | 0 | 598 | 291 | 165 |
| 2010's | 265 | 693 | 300 | 518 | 2,505 | 576 | 449 | 888 | 1,454 | 781 |
| 2020's | 502 |
| - = No Data Reported; -- = Not Applicable; NA = Not Available; W = Withheld to avoid disclosure of individual company data. |
| Release Date: 2/9/2022 |
| Next Release Date: Suspended |