|
Download Data (XLS File) |
|
|||||
|
|||||
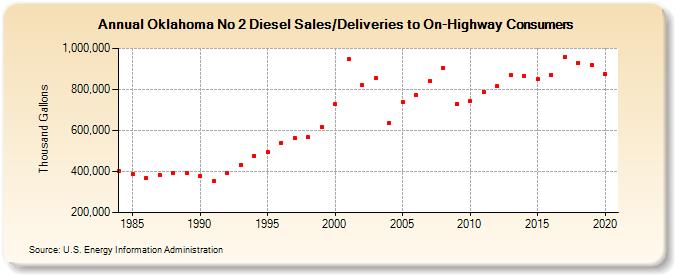
| Oklahoma No 2 Diesel Sales/Deliveries to On-Highway Consumers (Thousand Gallons) | |||||
| Decade | Year-0 | Year-1 | Year-2 | Year-3 | Year-4 | Year-5 | Year-6 | Year-7 | Year-8 | Year-9 |
|---|---|---|---|---|---|---|---|---|---|---|
| 1980's | 401,738 | 387,890 | 368,795 | 383,820 | 394,165 | 394,174 | ||||
| 1990's | 380,222 | 352,086 | 390,810 | 431,518 | 476,271 | 496,860 | 541,337 | 562,915 | 566,471 | 616,296 |
| 2000's | 728,583 | 947,603 | 819,929 | 855,483 | 636,979 | 739,025 | 773,308 | 840,366 | 906,265 | 729,736 |
| 2010's | 741,369 | 789,449 | 814,298 | 867,927 | 863,730 | 849,598 | 872,017 | 958,057 | 931,091 | 919,949 |
| 2020's | 876,698 |
| - = No Data Reported; -- = Not Applicable; NA = Not Available; W = Withheld to avoid disclosure of individual company data. |
| Release Date: 2/9/2022 |
| Next Release Date: Suspended |