|
Download Data (XLS File) |
|
|||||
|
|||||
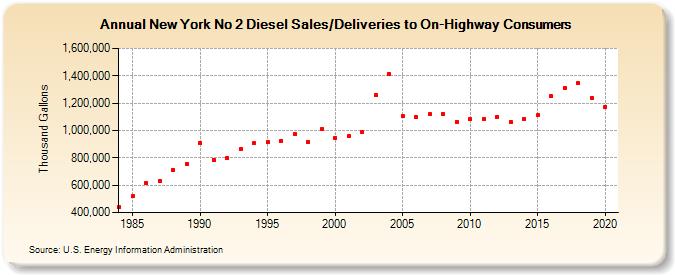
| New York No 2 Diesel Sales/Deliveries to On-Highway Consumers (Thousand Gallons) | |||||
| Decade | Year-0 | Year-1 | Year-2 | Year-3 | Year-4 | Year-5 | Year-6 | Year-7 | Year-8 | Year-9 |
|---|---|---|---|---|---|---|---|---|---|---|
| 1980's | 439,452 | 518,586 | 614,646 | 633,543 | 713,826 | 754,276 | ||||
| 1990's | 907,848 | 786,976 | 800,229 | 862,697 | 906,022 | 915,846 | 924,782 | 977,851 | 917,161 | 1,011,088 |
| 2000's | 946,272 | 956,982 | 988,428 | 1,258,604 | 1,410,982 | 1,104,919 | 1,096,953 | 1,118,505 | 1,120,424 | 1,064,997 |
| 2010's | 1,083,536 | 1,082,247 | 1,100,897 | 1,060,469 | 1,085,615 | 1,111,015 | 1,249,864 | 1,311,253 | 1,346,416 | 1,239,770 |
| 2020's | 1,172,851 |
| - = No Data Reported; -- = Not Applicable; NA = Not Available; W = Withheld to avoid disclosure of individual company data. |
| Release Date: 2/9/2022 |
| Next Release Date: Suspended |