|
Download Data (XLS File) |
|
|||||
|
|||||
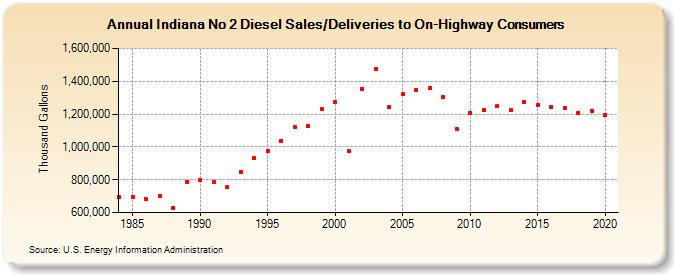
| Indiana No 2 Diesel Sales/Deliveries to On-Highway Consumers (Thousand Gallons) | |||||
| Decade | Year-0 | Year-1 | Year-2 | Year-3 | Year-4 | Year-5 | Year-6 | Year-7 | Year-8 | Year-9 |
|---|---|---|---|---|---|---|---|---|---|---|
| 1980's | 692,209 | 693,369 | 681,413 | 698,704 | 628,647 | 784,441 | ||||
| 1990's | 801,335 | 784,039 | 753,113 | 846,955 | 933,435 | 976,069 | 1,036,200 | 1,121,011 | 1,129,693 | 1,228,811 |
| 2000's | 1,272,013 | 976,154 | 1,354,201 | 1,473,954 | 1,242,988 | 1,319,432 | 1,348,615 | 1,356,498 | 1,302,135 | 1,109,103 |
| 2010's | 1,207,711 | 1,225,199 | 1,247,331 | 1,223,813 | 1,272,621 | 1,253,765 | 1,244,803 | 1,234,567 | 1,208,003 | 1,220,788 |
| 2020's | 1,195,387 |
| - = No Data Reported; -- = Not Applicable; NA = Not Available; W = Withheld to avoid disclosure of individual company data. |
| Release Date: 2/9/2022 |
| Next Release Date: Suspended |