|
Download Data (XLS File) |
|
|||||
|
|||||
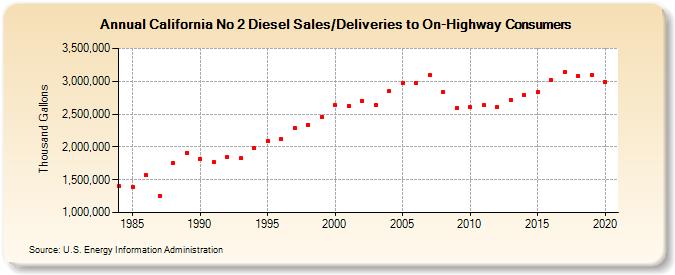
| California No 2 Diesel Sales/Deliveries to On-Highway Consumers (Thousand Gallons) | |||||
| Decade | Year-0 | Year-1 | Year-2 | Year-3 | Year-4 | Year-5 | Year-6 | Year-7 | Year-8 | Year-9 |
|---|---|---|---|---|---|---|---|---|---|---|
| 1980's | 1,399,258 | 1,387,378 | 1,570,607 | 1,256,749 | 1,760,085 | 1,913,647 | ||||
| 1990's | 1,819,718 | 1,769,575 | 1,842,723 | 1,824,363 | 1,985,649 | 2,089,687 | 2,115,704 | 2,288,069 | 2,339,261 | 2,458,325 |
| 2000's | 2,632,760 | 2,627,366 | 2,703,680 | 2,634,150 | 2,844,083 | 2,967,826 | 2,974,021 | 3,091,491 | 2,838,723 | 2,591,988 |
| 2010's | 2,602,646 | 2,633,352 | 2,603,546 | 2,719,596 | 2,786,973 | 2,834,081 | 3,016,434 | 3,134,964 | 3,085,251 | 3,096,496 |
| 2020's | 2,988,761 |
| - = No Data Reported; -- = Not Applicable; NA = Not Available; W = Withheld to avoid disclosure of individual company data. |
| Release Date: 2/9/2022 |
| Next Release Date: Suspended |