|
Download Data (XLS File) |
|
|||||
|
|||||
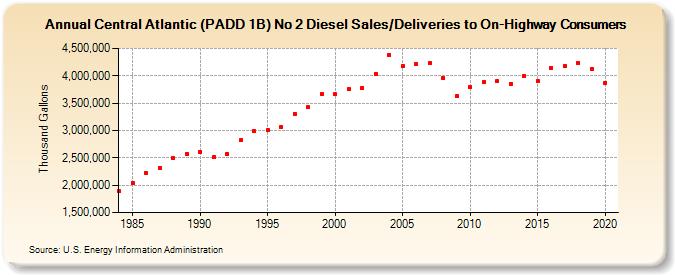
| Central Atlantic (PADD 1B) No 2 Diesel Sales/Deliveries to On-Highway Consumers (Thousand Gallons) | |||||
| Decade | Year-0 | Year-1 | Year-2 | Year-3 | Year-4 | Year-5 | Year-6 | Year-7 | Year-8 | Year-9 |
|---|---|---|---|---|---|---|---|---|---|---|
| 1980's | 1,886,467 | 2,043,424 | 2,225,520 | 2,319,009 | 2,497,825 | 2,571,926 | ||||
| 1990's | 2,615,308 | 2,511,511 | 2,569,627 | 2,819,157 | 2,987,381 | 3,007,852 | 3,063,474 | 3,306,771 | 3,420,503 | 3,673,911 |
| 2000's | 3,659,966 | 3,757,549 | 3,785,263 | 4,038,686 | 4,385,713 | 4,177,593 | 4,213,100 | 4,232,345 | 3,956,845 | 3,629,109 |
| 2010's | 3,796,971 | 3,883,499 | 3,898,410 | 3,856,457 | 3,986,380 | 3,909,917 | 4,143,695 | 4,172,215 | 4,241,973 | 4,123,514 |
| 2020's | 3,875,998 |
| - = No Data Reported; -- = Not Applicable; NA = Not Available; W = Withheld to avoid disclosure of individual company data. |
| Release Date: 2/9/2022 |
| Next Release Date: Suspended |