|
Download Data (XLS File) |
|
|||||
|
|||||
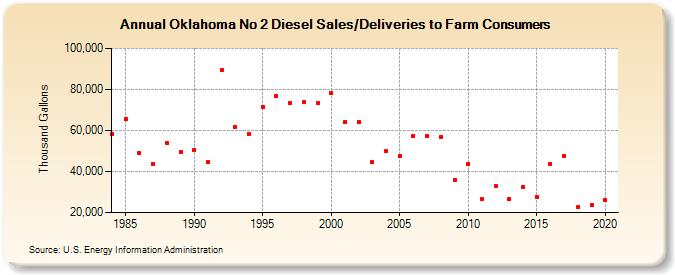
| Oklahoma No 2 Diesel Sales/Deliveries to Farm Consumers (Thousand Gallons) | |||||
| Decade | Year-0 | Year-1 | Year-2 | Year-3 | Year-4 | Year-5 | Year-6 | Year-7 | Year-8 | Year-9 |
|---|---|---|---|---|---|---|---|---|---|---|
| 1980's | 58,464 | 65,677 | 49,105 | 43,758 | 53,994 | 49,546 | ||||
| 1990's | 50,665 | 44,547 | 89,645 | 61,827 | 58,441 | 71,617 | 76,743 | 73,449 | 73,663 | 73,435 |
| 2000's | 78,051 | 64,083 | 64,083 | 44,449 | 49,793 | 47,390 | 57,397 | 57,403 | 56,885 | 36,066 |
| 2010's | 43,851 | 26,505 | 33,172 | 26,674 | 32,625 | 27,637 | 43,584 | 47,753 | 22,471 | 23,789 |
| 2020's | 26,190 |
| - = No Data Reported; -- = Not Applicable; NA = Not Available; W = Withheld to avoid disclosure of individual company data. |
| Release Date: 2/9/2022 |
| Next Release Date: Suspended |