|
Download Data (XLS File) |
|
|||||
|
|||||
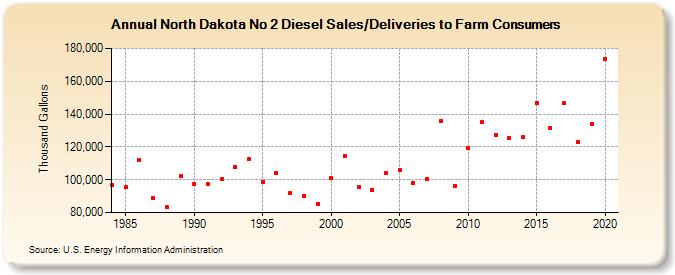
| North Dakota No 2 Diesel Sales/Deliveries to Farm Consumers (Thousand Gallons) | |||||
| Decade | Year-0 | Year-1 | Year-2 | Year-3 | Year-4 | Year-5 | Year-6 | Year-7 | Year-8 | Year-9 |
|---|---|---|---|---|---|---|---|---|---|---|
| 1980's | 96,914 | 95,372 | 111,957 | 88,991 | 83,192 | 102,035 | ||||
| 1990's | 97,510 | 97,494 | 100,635 | 107,808 | 112,339 | 98,890 | 104,208 | 91,974 | 90,142 | 85,296 |
| 2000's | 100,988 | 114,385 | 95,704 | 93,976 | 103,793 | 106,005 | 98,095 | 100,554 | 136,067 | 96,106 |
| 2010's | 119,470 | 134,935 | 126,979 | 125,496 | 126,043 | 146,840 | 131,588 | 146,721 | 122,893 | 133,827 |
| 2020's | 173,766 |
| - = No Data Reported; -- = Not Applicable; NA = Not Available; W = Withheld to avoid disclosure of individual company data. |
| Release Date: 2/9/2022 |
| Next Release Date: Suspended |