|
Download Data (XLS File) |
|
|||||
|
|||||
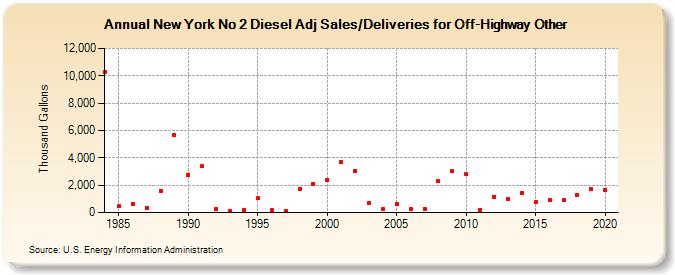
| New York No 2 Diesel Adj Sales/Deliveries for Off-Highway Other (Thousand Gallons) | |||||
| Decade | Year-0 | Year-1 | Year-2 | Year-3 | Year-4 | Year-5 | Year-6 | Year-7 | Year-8 | Year-9 |
|---|---|---|---|---|---|---|---|---|---|---|
| 1980's | 10,285 | 460 | 632 | 345 | 1,582 | 5,689 | ||||
| 1990's | 2,768 | 3,371 | 284 | 122 | 203 | 1,029 | 177 | 103 | 1,752 | 2,091 |
| 2000's | 2,385 | 3,674 | 3,074 | 674 | 237 | 619 | 272 | 276 | 2,280 | 3,019 |
| 2010's | 2,812 | 216 | 1,172 | 962 | 1,449 | 736 | 904 | 940 | 1,249 | 1,703 |
| 2020's | 1,681 |
| - = No Data Reported; -- = Not Applicable; NA = Not Available; W = Withheld to avoid disclosure of individual company data. |
| Release Date: 2/9/2022 |
| Next Release Date: Suspended |