|
Download Data (XLS File) |
|
|||||
|
|||||
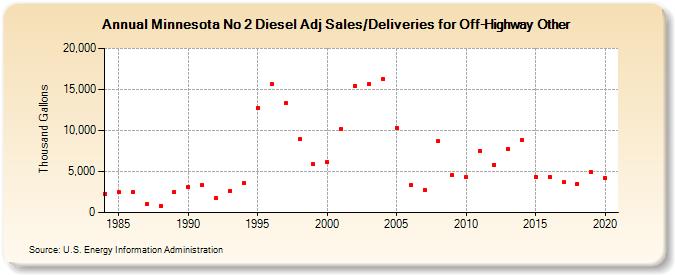
| Minnesota No 2 Diesel Adj Sales/Deliveries for Off-Highway Other (Thousand Gallons) | |||||
| Decade | Year-0 | Year-1 | Year-2 | Year-3 | Year-4 | Year-5 | Year-6 | Year-7 | Year-8 | Year-9 |
|---|---|---|---|---|---|---|---|---|---|---|
| 1980's | 2,316 | 2,459 | 2,455 | 1,009 | 848 | 2,532 | ||||
| 1990's | 3,090 | 3,369 | 1,713 | 2,639 | 3,623 | 12,796 | 15,637 | 13,296 | 8,952 | 5,884 |
| 2000's | 6,159 | 10,154 | 15,389 | 15,616 | 16,276 | 10,338 | 3,313 | 2,751 | 8,667 | 4,563 |
| 2010's | 4,331 | 7,482 | 5,825 | 7,747 | 8,845 | 4,390 | 4,364 | 3,685 | 3,522 | 4,892 |
| 2020's | 4,243 |
| - = No Data Reported; -- = Not Applicable; NA = Not Available; W = Withheld to avoid disclosure of individual company data. |
| Release Date: 2/9/2022 |
| Next Release Date: Suspended |