|
Download Data (XLS File) |
|
|||||
|
|||||
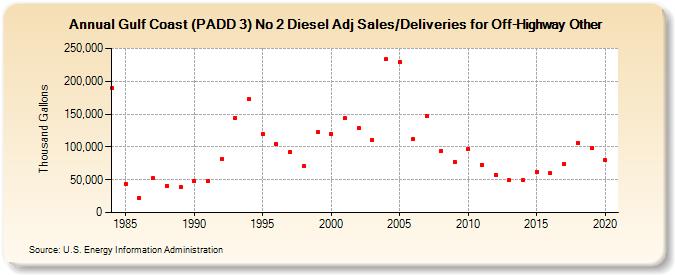
| Gulf Coast (PADD 3) No 2 Diesel Adj Sales/Deliveries for Off-Highway Other (Thousand Gallons) | |||||
| Decade | Year-0 | Year-1 | Year-2 | Year-3 | Year-4 | Year-5 | Year-6 | Year-7 | Year-8 | Year-9 |
|---|---|---|---|---|---|---|---|---|---|---|
| 1980's | 189,748 | 43,963 | 22,687 | 52,417 | 40,846 | 39,013 | ||||
| 1990's | 48,319 | 47,382 | 82,255 | 144,476 | 172,853 | 120,375 | 104,173 | 91,973 | 70,182 | 121,920 |
| 2000's | 120,093 | 143,240 | 128,723 | 110,148 | 233,168 | 229,040 | 111,814 | 146,418 | 93,384 | 77,690 |
| 2010's | 96,496 | 72,887 | 57,686 | 48,963 | 49,165 | 62,321 | 59,598 | 74,655 | 106,411 | 97,705 |
| 2020's | 79,847 |
| - = No Data Reported; -- = Not Applicable; NA = Not Available; W = Withheld to avoid disclosure of individual company data. |
| Release Date: 2/9/2022 |
| Next Release Date: Suspended |