|
Download Data (XLS File) |
|
|||||
|
|||||
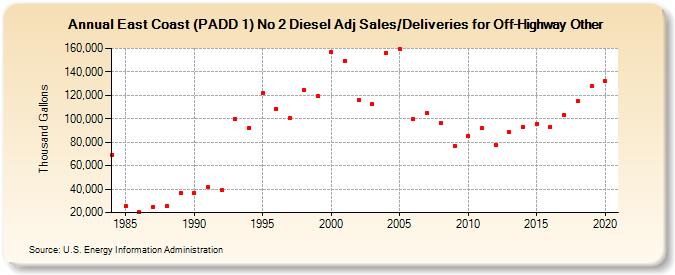
| East Coast (PADD 1) No 2 Diesel Adj Sales/Deliveries for Off-Highway Other (Thousand Gallons) | |||||
| Decade | Year-0 | Year-1 | Year-2 | Year-3 | Year-4 | Year-5 | Year-6 | Year-7 | Year-8 | Year-9 |
|---|---|---|---|---|---|---|---|---|---|---|
| 1980's | 69,453 | 25,171 | 20,725 | 25,132 | 25,533 | 36,712 | ||||
| 1990's | 36,682 | 41,415 | 39,260 | 99,694 | 92,438 | 121,858 | 108,581 | 100,993 | 124,358 | 119,201 |
| 2000's | 157,005 | 149,494 | 115,892 | 112,380 | 156,118 | 159,651 | 99,544 | 104,795 | 96,382 | 76,562 |
| 2010's | 85,534 | 91,883 | 77,718 | 88,634 | 93,123 | 95,322 | 93,240 | 103,593 | 114,919 | 127,541 |
| 2020's | 131,961 |
| - = No Data Reported; -- = Not Applicable; NA = Not Available; W = Withheld to avoid disclosure of individual company data. |
| Release Date: 2/9/2022 |
| Next Release Date: Suspended |