|
Download Data (XLS File) |
|
|||||
|
|||||
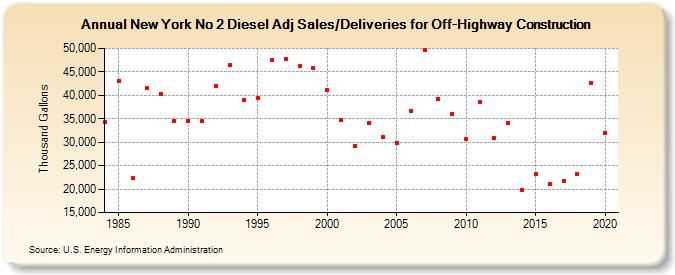
| New York No 2 Diesel Adj Sales/Deliveries for Off-Highway Construction (Thousand Gallons) | |||||
| Decade | Year-0 | Year-1 | Year-2 | Year-3 | Year-4 | Year-5 | Year-6 | Year-7 | Year-8 | Year-9 |
|---|---|---|---|---|---|---|---|---|---|---|
| 1980's | 34,229 | 43,027 | 22,346 | 41,574 | 40,381 | 34,610 | ||||
| 1990's | 34,567 | 34,494 | 41,926 | 46,359 | 39,070 | 39,462 | 47,508 | 47,683 | 46,166 | 45,810 |
| 2000's | 41,102 | 34,653 | 29,164 | 34,161 | 31,198 | 29,895 | 36,722 | 49,706 | 39,259 | 36,089 |
| 2010's | 30,713 | 38,511 | 30,908 | 34,102 | 19,827 | 23,170 | 21,063 | 21,692 | 23,133 | 42,605 |
| 2020's | 31,965 |
| - = No Data Reported; -- = Not Applicable; NA = Not Available; W = Withheld to avoid disclosure of individual company data. |
| Release Date: 2/9/2022 |
| Next Release Date: Suspended |