|
Download Data (XLS File) |
|
|||||
|
|||||
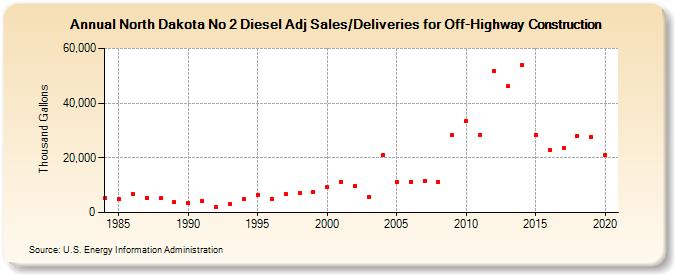
| North Dakota No 2 Diesel Adj Sales/Deliveries for Off-Highway Construction (Thousand Gallons) | |||||
| Decade | Year-0 | Year-1 | Year-2 | Year-3 | Year-4 | Year-5 | Year-6 | Year-7 | Year-8 | Year-9 |
|---|---|---|---|---|---|---|---|---|---|---|
| 1980's | 5,348 | 4,822 | 6,623 | 5,400 | 5,226 | 3,942 | ||||
| 1990's | 3,656 | 4,340 | 2,017 | 3,033 | 4,977 | 6,512 | 5,075 | 6,629 | 7,271 | 7,644 |
| 2000's | 9,305 | 11,230 | 9,774 | 5,525 | 20,915 | 11,247 | 11,342 | 11,445 | 11,336 | 28,261 |
| 2010's | 33,446 | 28,517 | 51,729 | 46,151 | 54,074 | 28,478 | 22,953 | 23,417 | 28,077 | 27,533 |
| 2020's | 20,922 |
| - = No Data Reported; -- = Not Applicable; NA = Not Available; W = Withheld to avoid disclosure of individual company data. |
| Release Date: 2/9/2022 |
| Next Release Date: Suspended |