|
Download Data (XLS File) |
|
|||||
|
|||||
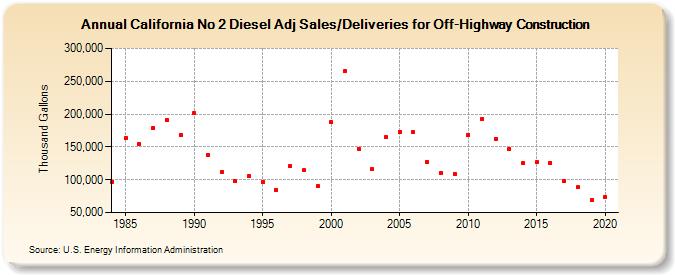
| California No 2 Diesel Adj Sales/Deliveries for Off-Highway Construction (Thousand Gallons) | |||||
| Decade | Year-0 | Year-1 | Year-2 | Year-3 | Year-4 | Year-5 | Year-6 | Year-7 | Year-8 | Year-9 |
|---|---|---|---|---|---|---|---|---|---|---|
| 1980's | 97,238 | 163,557 | 154,383 | 178,983 | 190,941 | 167,842 | ||||
| 1990's | 201,539 | 137,604 | 112,254 | 97,976 | 105,731 | 96,899 | 84,317 | 120,772 | 114,147 | 90,342 |
| 2000's | 187,466 | 265,166 | 146,865 | 115,951 | 164,491 | 172,774 | 172,103 | 127,353 | 110,195 | 108,861 |
| 2010's | 168,863 | 192,484 | 162,470 | 147,081 | 125,287 | 126,406 | 126,067 | 97,383 | 88,271 | 68,739 |
| 2020's | 73,693 |
| - = No Data Reported; -- = Not Applicable; NA = Not Available; W = Withheld to avoid disclosure of individual company data. |
| Release Date: 2/9/2022 |
| Next Release Date: Suspended |