|
Download Data (XLS File) |
|
|||||
|
|||||
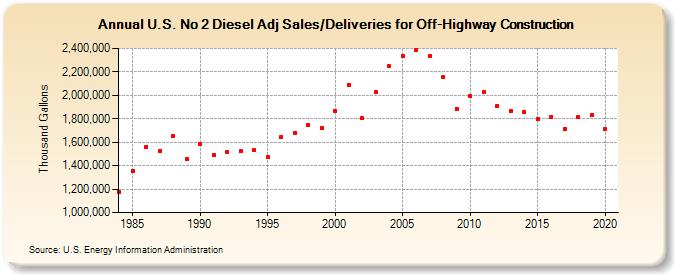
| U.S. No 2 Diesel Adj Sales/Deliveries for Off-Highway Construction (Thousand Gallons) | |||||
| Decade | Year-0 | Year-1 | Year-2 | Year-3 | Year-4 | Year-5 | Year-6 | Year-7 | Year-8 | Year-9 |
|---|---|---|---|---|---|---|---|---|---|---|
| 1980's | 1,179,504 | 1,353,515 | 1,561,920 | 1,521,643 | 1,650,198 | 1,454,992 | ||||
| 1990's | 1,581,463 | 1,492,032 | 1,514,205 | 1,526,043 | 1,531,300 | 1,472,827 | 1,645,647 | 1,678,482 | 1,749,317 | 1,723,597 |
| 2000's | 1,869,217 | 2,091,634 | 1,805,688 | 2,028,662 | 2,247,370 | 2,337,248 | 2,389,602 | 2,334,459 | 2,151,912 | 1,886,928 |
| 2010's | 1,998,206 | 2,024,774 | 1,909,326 | 1,867,381 | 1,853,697 | 1,798,265 | 1,813,630 | 1,713,458 | 1,811,980 | 1,830,095 |
| 2020's | 1,709,993 |
| - = No Data Reported; -- = Not Applicable; NA = Not Available; W = Withheld to avoid disclosure of individual company data. |
| Release Date: 2/9/2022 |
| Next Release Date: Suspended |