|
Download Data (XLS File) |
|
|||||
|
|||||
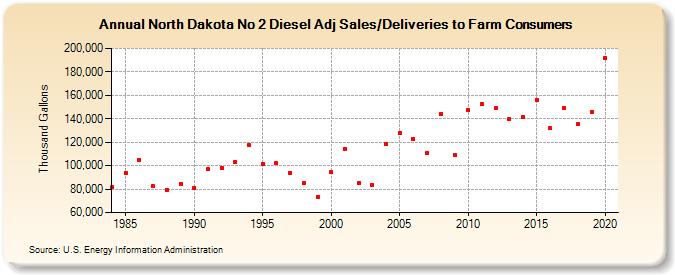
| North Dakota No 2 Diesel Adj Sales/Deliveries to Farm Consumers (Thousand Gallons) | |||||
| Decade | Year-0 | Year-1 | Year-2 | Year-3 | Year-4 | Year-5 | Year-6 | Year-7 | Year-8 | Year-9 |
|---|---|---|---|---|---|---|---|---|---|---|
| 1980's | 81,462 | 93,836 | 105,216 | 82,353 | 79,556 | 84,688 | ||||
| 1990's | 81,135 | 96,731 | 98,295 | 103,447 | 117,865 | 101,742 | 102,136 | 94,033 | 84,835 | 73,540 |
| 2000's | 94,292 | 114,101 | 85,303 | 83,920 | 118,868 | 127,964 | 122,902 | 110,604 | 144,472 | 109,376 |
| 2010's | 147,338 | 152,668 | 148,947 | 139,729 | 141,692 | 155,808 | 131,871 | 149,228 | 135,401 | 145,985 |
| 2020's | 191,818 |
| - = No Data Reported; -- = Not Applicable; NA = Not Available; W = Withheld to avoid disclosure of individual company data. |
| Release Date: 2/9/2022 |
| Next Release Date: Suspended |