|
Download Data (XLS File) |
|
|||||
|
|||||
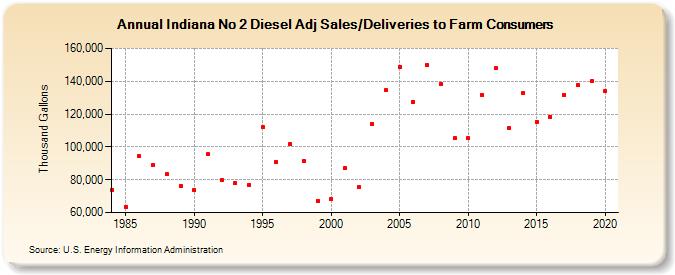
| Indiana No 2 Diesel Adj Sales/Deliveries to Farm Consumers (Thousand Gallons) | |||||
| Decade | Year-0 | Year-1 | Year-2 | Year-3 | Year-4 | Year-5 | Year-6 | Year-7 | Year-8 | Year-9 |
|---|---|---|---|---|---|---|---|---|---|---|
| 1980's | 74,016 | 63,612 | 94,206 | 88,881 | 83,246 | 76,272 | ||||
| 1990's | 73,611 | 95,406 | 79,689 | 77,726 | 76,984 | 111,819 | 90,700 | 101,772 | 91,427 | 67,330 |
| 2000's | 68,036 | 87,094 | 75,370 | 113,806 | 134,416 | 148,616 | 127,631 | 149,957 | 138,236 | 105,256 |
| 2010's | 105,146 | 131,808 | 147,871 | 111,474 | 132,647 | 115,206 | 118,503 | 131,874 | 137,491 | 139,983 |
| 2020's | 133,834 |
| - = No Data Reported; -- = Not Applicable; NA = Not Available; W = Withheld to avoid disclosure of individual company data. |
| Release Date: 2/9/2022 |
| Next Release Date: Suspended |