|
Download Data (XLS File) |
|
||||||||
|
||||||||
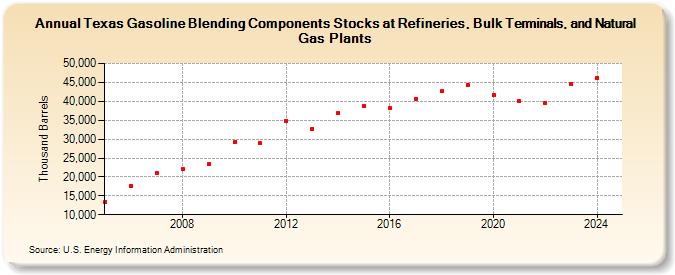
| Texas Gasoline Blending Components Stocks at Refineries, Bulk Terminals, and Natural Gas Plants (Thousand Barrels) | ||||||||
| Decade | Year-0 | Year-1 | Year-2 | Year-3 | Year-4 | Year-5 | Year-6 | Year-7 | Year-8 | Year-9 |
|---|---|---|---|---|---|---|---|---|---|---|
| 2000's | 13,309 | 17,698 | 20,931 | 22,079 | 23,316 | |||||
| 2010's | 29,194 | 28,836 | 34,916 | 32,800 | 36,961 | 38,802 | 38,149 | 40,689 | 42,640 | 44,400 |
| 2020's | 41,626 | 39,971 | 39,677 | 45,223 |
| - = No Data Reported; -- = Not Applicable; NA = Not Available; W = Withheld to avoid disclosure of individual company data. |
| Release Date: 3/29/2024 |
| Next Release Date: 8/30/2024 |