|
Download Data (XLS File) |
|
||||||||
|
||||||||
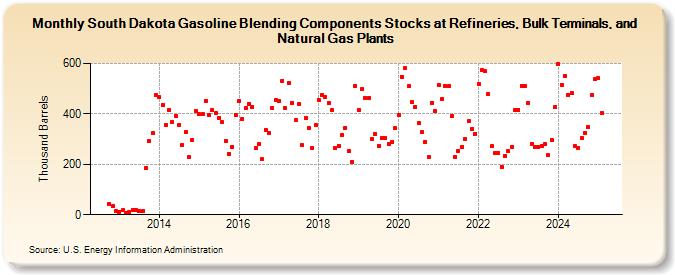
| South Dakota Gasoline Blending Components Stocks at Refineries, Bulk Terminals, and Natural Gas Plants (Thousand Barrels) | ||||||||
| Year | Jan | Feb | Mar | Apr | May | Jun | Jul | Aug | Sep | Oct | Nov | Dec |
|---|---|---|---|---|---|---|---|---|---|---|---|---|
| 2012 | 44 | 34 | 14 | |||||||||
| 2013 | 12 | 17 | 6 | 11 | 18 | 19 | 13 | 13 | 185 | 292 | 323 | 474 |
| 2014 | 468 | 435 | 356 | 415 | 366 | 391 | 356 | 277 | 328 | 227 | 296 | 411 |
| 2015 | 399 | 398 | 452 | 396 | 415 | 403 | 385 | 366 | 292 | 242 | 270 | 397 |
| 2016 | 452 | 380 | 423 | 441 | 428 | 264 | 282 | 220 | 338 | 326 | 423 | 456 |
| 2017 | 450 | 532 | 425 | 524 | 443 | 376 | 441 | 276 | 385 | 345 | 266 | 354 |
| 2018 | 454 | 475 | 467 | 445 | 417 | 266 | 273 | 317 | 346 | 251 | 211 | 510 |
| 2019 | 415 | 499 | 464 | 464 | 302 | 321 | 274 | 305 | 304 | 281 | 290 | 343 |
| 2020 | 396 | 548 | 581 | 510 | 446 | 428 | 365 | 328 | 290 | 229 | 445 | 411 |
| 2021 | 513 | 460 | 512 | 510 | 391 | 229 | 254 | 268 | 302 | 370 | 340 | 321 |
| 2022 | 518 | 573 | 570 | 478 | 271 | 246 | 245 | 190 | 234 | 251 | 269 | 417 |
| 2023 | 417 | 512 | 510 | 443 | 282 | 267 | 269 | 273 | 282 | 235 | 296 | 429 |
| 2024 | 597 | 515 | 550 | 476 | ||||||||
| - = No Data Reported; -- = Not Applicable; NA = Not Available; W = Withheld to avoid disclosure of individual company data. |
| Release Date: 6/28/2024 |
| Next Release Date: 7/31/2024 |