|
Download Data (XLS File) |
|
||||||||
|
||||||||
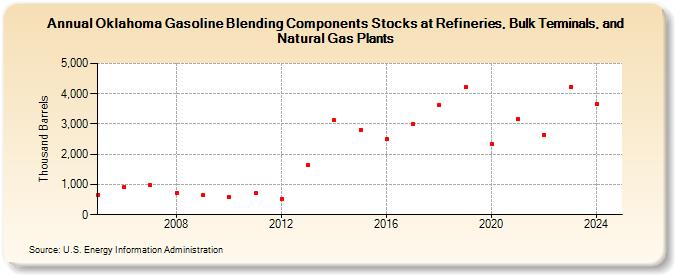
| Oklahoma Gasoline Blending Components Stocks at Refineries, Bulk Terminals, and Natural Gas Plants (Thousand Barrels) | ||||||||
| Decade | Year-0 | Year-1 | Year-2 | Year-3 | Year-4 | Year-5 | Year-6 | Year-7 | Year-8 | Year-9 |
|---|---|---|---|---|---|---|---|---|---|---|
| 2000's | 652 | 904 | 967 | 722 | 650 | |||||
| 2010's | 582 | 708 | 535 | 1,633 | 3,122 | 2,811 | 2,496 | 3,001 | 3,618 | 4,216 |
| 2020's | 2,328 | 3,158 | 2,648 | 4,220 |
| - = No Data Reported; -- = Not Applicable; NA = Not Available; W = Withheld to avoid disclosure of individual company data. |
| Release Date: 3/29/2024 |
| Next Release Date: 8/30/2024 |