|
Download Data (XLS File) |
|
||||||||
|
||||||||
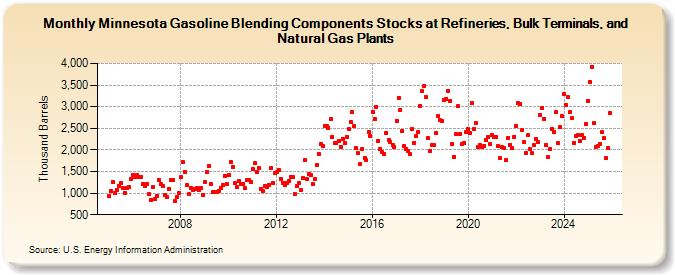
| Minnesota Gasoline Blending Components Stocks at Refineries, Bulk Terminals, and Natural Gas Plants (Thousand Barrels) | ||||||||
| Year | Jan | Feb | Mar | Apr | May | Jun | Jul | Aug | Sep | Oct | Nov | Dec |
|---|---|---|---|---|---|---|---|---|---|---|---|---|
| 2005 | 926 | 1,042 | 1,250 | 1,004 | 1,082 | 1,175 | 1,243 | 1,114 | 1,008 | 1,117 | 1,146 | 1,334 |
| 2006 | 1,422 | 1,379 | 1,424 | 1,370 | 1,364 | 1,212 | 1,160 | 1,211 | 977 | 846 | 1,144 | 858 |
| 2007 | 938 | 1,303 | 1,202 | 1,154 | 949 | 904 | 1,102 | 1,313 | 1,294 | 811 | 912 | 997 |
| 2008 | 1,364 | 1,716 | 1,489 | 1,179 | 968 | 1,124 | 1,082 | 1,100 | 1,120 | 1,062 | 1,107 | 962 |
| 2009 | 1,248 | 1,492 | 1,636 | 1,214 | 1,017 | 1,028 | 1,023 | 1,055 | 1,129 | 1,191 | 1,398 | 1,219 |
| 2010 | 1,409 | 1,718 | 1,600 | 1,227 | 1,130 | 1,284 | 1,212 | 1,211 | 1,114 | 1,300 | 1,296 | 1,246 |
| 2011 | 1,568 | 1,690 | 1,489 | 1,576 | 1,101 | 1,042 | 1,158 | 1,135 | 1,195 | 1,578 | 1,236 | 1,460 |
| 2012 | 1,493 | 1,541 | 1,336 | 1,245 | 1,183 | 1,238 | 1,271 | 1,383 | 1,369 | 988 | 1,175 | 1,223 |
| 2013 | 1,071 | 1,342 | 1,761 | 1,322 | 1,437 | 1,412 | 1,212 | 1,318 | 1,662 | 1,913 | 2,137 | 2,101 |
| 2014 | 2,551 | 2,544 | 2,516 | 2,726 | 2,309 | 2,150 | 2,150 | 2,205 | 2,076 | 2,254 | 2,165 | 2,296 |
| 2015 | 2,483 | 2,654 | 2,881 | 2,556 | 2,035 | 1,922 | 1,679 | 2,016 | 1,816 | 1,761 | 2,409 | 2,328 |
| 2016 | 2,888 | 2,707 | 2,996 | 2,217 | 2,031 | 1,943 | 1,907 | 2,399 | 2,234 | 2,177 | 2,114 | 2,066 |
| 2017 | 2,679 | 3,211 | 2,933 | 2,436 | 2,096 | 2,022 | 1,971 | 1,903 | 2,479 | 2,162 | 2,312 | 2,414 |
| 2018 | 3,018 | 3,353 | 3,484 | 3,219 | 2,266 | 1,972 | 2,116 | 2,107 | 2,400 | 2,789 | 2,686 | 2,674 |
| 2019 | 3,147 | 3,181 | 3,371 | 3,134 | 2,144 | 1,841 | 2,366 | 3,008 | 2,376 | 2,126 | 2,161 | 2,405 |
| 2020 | 2,481 | 2,388 | 3,075 | 2,482 | 2,626 | 2,057 | 2,115 | 2,067 | 2,095 | 2,220 | 2,296 | 2,139 |
| 2021 | 2,346 | 2,307 | 2,287 | 2,086 | 1,816 | 2,066 | 2,042 | 1,767 | 2,285 | 2,124 | 2,037 | 2,307 |
| 2022 | 2,551 | 3,075 | 3,057 | 2,451 | 2,181 | 1,939 | 2,340 | 2,026 | 1,921 | 2,117 | 2,259 | 2,174 |
| 2023 | 2,803 | 2,974 | 2,724 | 2,119 | 1,833 | 2,023 | 2,473 | 2,415 | 2,867 | 2,159 | 2,522 | 2,778 |
| 2024 | 3,293 | 3,048 | 3,221 | 2,872 | ||||||||
| - = No Data Reported; -- = Not Applicable; NA = Not Available; W = Withheld to avoid disclosure of individual company data. |
| Release Date: 6/28/2024 |
| Next Release Date: 7/31/2024 |