|
Download Data (XLS File) |
|
||||||||
|
||||||||
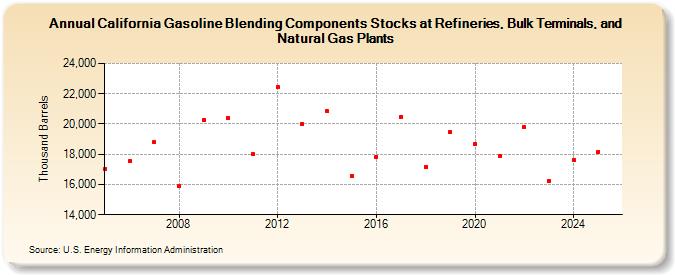
| California Gasoline Blending Components Stocks at Refineries, Bulk Terminals, and Natural Gas Plants (Thousand Barrels) | ||||||||
| Decade | Year-0 | Year-1 | Year-2 | Year-3 | Year-4 | Year-5 | Year-6 | Year-7 | Year-8 | Year-9 |
|---|---|---|---|---|---|---|---|---|---|---|
| 2000's | 17,028 | 17,536 | 18,791 | 15,871 | 20,279 | |||||
| 2010's | 20,399 | 18,012 | 22,458 | 20,005 | 20,841 | 16,578 | 17,818 | 20,471 | 17,175 | 19,477 |
| 2020's | 18,673 | 17,888 | 19,781 | 16,231 |
| - = No Data Reported; -- = Not Applicable; NA = Not Available; W = Withheld to avoid disclosure of individual company data. |
| Release Date: 3/29/2024 |
| Next Release Date: 8/30/2024 |