|
Download Data (XLS File) |
|
||||||||
|
||||||||
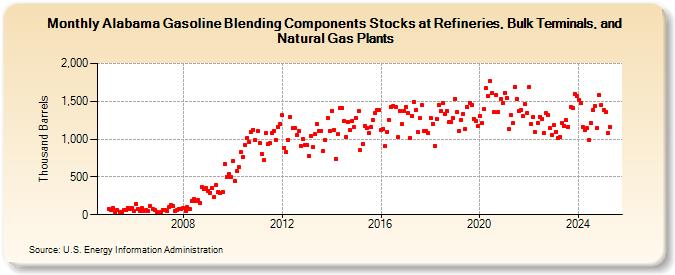
| Alabama Gasoline Blending Components Stocks at Refineries, Bulk Terminals, and Natural Gas Plants (Thousand Barrels) | ||||||||
| Year | Jan | Feb | Mar | Apr | May | Jun | Jul | Aug | Sep | Oct | Nov | Dec |
|---|---|---|---|---|---|---|---|---|---|---|---|---|
| 2005 | 73 | 60 | 86 | 32 | 63 | 39 | 42 | 56 | 66 | 95 | 76 | 89 |
| 2006 | 51 | 142 | 74 | 46 | 83 | 53 | 63 | 46 | 111 | 81 | 59 | 33 |
| 2007 | 26 | 37 | 67 | 66 | 46 | 97 | 130 | 109 | 48 | 62 | 71 | 80 |
| 2008 | 85 | 53 | 98 | 77 | 186 | 210 | 178 | 190 | 152 | 367 | 337 | 350 |
| 2009 | 319 | 293 | 349 | 233 | 390 | 305 | 288 | 297 | 665 | 498 | 543 | 501 |
| 2010 | 713 | 447 | 575 | 626 | 830 | 764 | 921 | 1,015 | 959 | 1,100 | 1,122 | 987 |
| 2011 | 1,104 | 954 | 809 | 719 | 1,076 | 940 | 944 | 1,076 | 1,108 | 990 | 1,160 | 1,203 |
| 2012 | 1,314 | 885 | 824 | 987 | 1,293 | 1,150 | 1,151 | 1,051 | 1,103 | 913 | 997 | 922 |
| 2013 | 916 | 778 | 1,041 | 895 | 1,062 | 1,196 | 1,108 | 1,108 | 837 | 985 | 1,285 | 1,106 |
| 2014 | 1,375 | 1,122 | 741 | 1,061 | 1,413 | 1,408 | 1,241 | 1,027 | 1,232 | 1,115 | 1,245 | 1,154 |
| 2015 | 1,281 | 1,372 | 858 | 931 | 1,176 | 1,151 | 1,081 | 1,159 | 1,256 | 1,351 | 1,383 | 1,380 |
| 2016 | 1,115 | 1,140 | 904 | 1,094 | 1,246 | 1,424 | 1,444 | 1,426 | 1,022 | 1,378 | 1,196 | 1,371 |
| 2017 | 1,426 | 1,348 | 1,019 | 1,308 | 1,497 | 1,386 | 1,092 | 1,275 | 1,447 | 1,111 | 1,110 | 1,079 |
| 2018 | 1,280 | 1,205 | 915 | 1,267 | 1,457 | 1,365 | 1,471 | 1,329 | 1,372 | 1,225 | 1,226 | 1,280 |
| 2019 | 1,536 | 1,353 | 1,105 | 1,256 | 1,334 | 1,138 | 1,421 | 1,482 | 1,457 | 1,271 | 1,233 | 1,172 |
| 2020 | 1,303 | 1,207 | 1,395 | 1,671 | 1,571 | 1,764 | 1,610 | 1,358 | 1,578 | 1,364 | 1,536 | 1,472 |
| 2021 | 1,616 | 1,550 | 1,131 | 1,320 | 1,207 | 1,694 | 1,525 | 1,374 | 1,387 | 1,301 | 1,464 | 1,346 |
| 2022 | 1,689 | 1,200 | 1,293 | 1,090 | 1,214 | 1,296 | 1,265 | 1,081 | 1,340 | 1,317 | 1,142 | 1,060 |
| 2023 | 1,181 | 1,098 | 1,013 | 1,022 | 1,213 | 1,175 | 1,246 | 1,159 | 1,424 | 1,412 | 1,602 | 1,569 |
| 2024 | 1,521 | 1,479 | 1,160 | 1,119 | 1,143 | 987 | ||||||
| - = No Data Reported; -- = Not Applicable; NA = Not Available; W = Withheld to avoid disclosure of individual company data. |
| Release Date: 8/30/2024 |
| Next Release Date: 9/30/2024 |