|
Download Data (XLS File) |
|
||||||||
|
||||||||
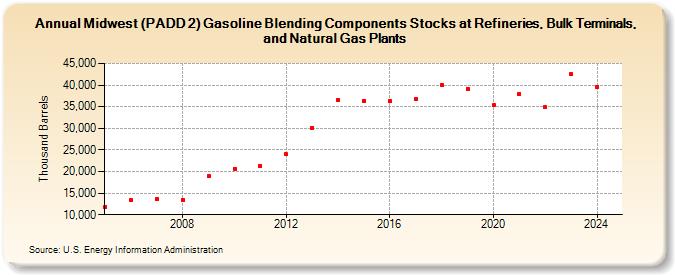
| Midwest (PADD 2) Gasoline Blending Components Stocks at Refineries, Bulk Terminals, and Natural Gas Plants (Thousand Barrels) | ||||||||
| Decade | Year-0 | Year-1 | Year-2 | Year-3 | Year-4 | Year-5 | Year-6 | Year-7 | Year-8 | Year-9 |
|---|---|---|---|---|---|---|---|---|---|---|
| 2000's | 11,899 | 13,341 | 13,607 | 13,458 | 18,957 | |||||
| 2010's | 20,652 | 21,386 | 23,961 | 30,136 | 36,660 | 36,400 | 36,235 | 36,668 | 40,074 | 39,180 |
| 2020's | 35,318 | 37,962 | 34,897 | 42,523 |
| - = No Data Reported; -- = Not Applicable; NA = Not Available; W = Withheld to avoid disclosure of individual company data. |
| Release Date: 3/29/2024 |
| Next Release Date: 8/30/2024 |