|
Download Data (XLS File) |
|
||||||||
|
||||||||
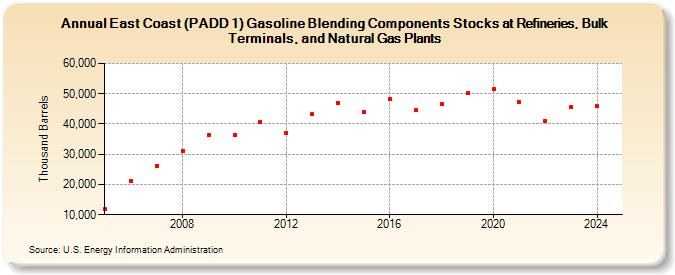
| East Coast (PADD 1) Gasoline Blending Components Stocks at Refineries, Bulk Terminals, and Natural Gas Plants (Thousand Barrels) | ||||||||
| Decade | Year-0 | Year-1 | Year-2 | Year-3 | Year-4 | Year-5 | Year-6 | Year-7 | Year-8 | Year-9 |
|---|---|---|---|---|---|---|---|---|---|---|
| 2000's | 11,748 | 21,003 | 26,150 | 31,163 | 36,274 | |||||
| 2010's | 36,425 | 40,747 | 36,945 | 43,153 | 46,902 | 43,797 | 48,262 | 44,559 | 46,745 | 50,212 |
| 2020's | 51,579 | 47,148 | 41,096 | 45,601 |
| - = No Data Reported; -- = Not Applicable; NA = Not Available; W = Withheld to avoid disclosure of individual company data. |
| Release Date: 8/30/2024 |
| Next Release Date: 8/29/2025 |