|
Download Data (XLS File) |
|
||||||||
|
||||||||
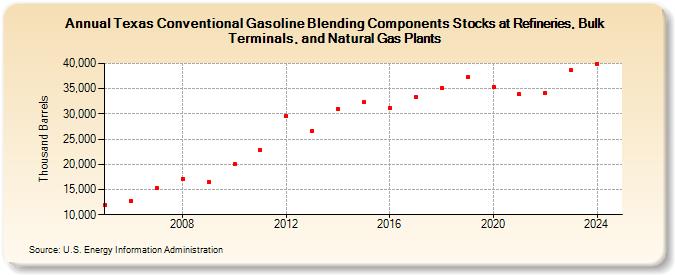
| Texas Conventional Gasoline Blending Components Stocks at Refineries, Bulk Terminals, and Natural Gas Plants (Thousand Barrels) | ||||||||
| Decade | Year-0 | Year-1 | Year-2 | Year-3 | Year-4 | Year-5 | Year-6 | Year-7 | Year-8 | Year-9 |
|---|---|---|---|---|---|---|---|---|---|---|
| 2000's | 11,974 | 12,782 | 15,280 | 17,089 | 16,511 | |||||
| 2010's | 20,043 | 22,875 | 29,555 | 26,654 | 30,971 | 32,284 | 31,126 | 33,362 | 35,151 | 37,244 |
| 2020's | 35,403 | 33,852 | 34,241 | 38,601 |
| - = No Data Reported; -- = Not Applicable; NA = Not Available; W = Withheld to avoid disclosure of individual company data. |
| Release Date: 3/29/2024 |
| Next Release Date: 8/30/2024 |