|
Download Data (XLS File) |
|
||||||||
|
||||||||
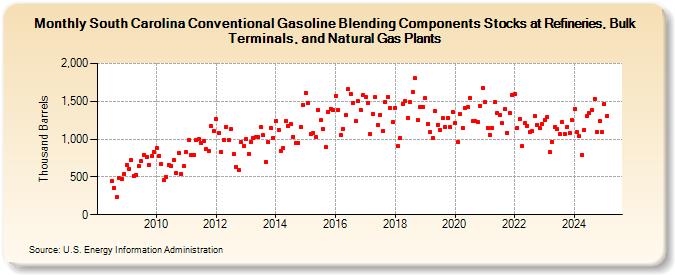
| South Carolina Conventional Gasoline Blending Components Stocks at Refineries, Bulk Terminals, and Natural Gas Plants (Thousand Barrels) | ||||||||
| Year | Jan | Feb | Mar | Apr | May | Jun | Jul | Aug | Sep | Oct | Nov | Dec |
|---|---|---|---|---|---|---|---|---|---|---|---|---|
| 2008 | 446 | 359 | 229 | 482 | 478 | 543 | ||||||
| 2009 | 657 | 611 | 718 | 518 | 531 | 638 | 707 | 794 | 758 | 664 | 771 | 834 |
| 2010 | 884 | 781 | 671 | 458 | 505 | 658 | 649 | 718 | 552 | 813 | 539 | 639 |
| 2011 | 826 | 989 | 788 | 794 | 987 | 998 | 953 | 981 | 870 | 843 | 1,172 | 1,107 |
| 2012 | 1,260 | 1,079 | 833 | 988 | 1,165 | 991 | 1,131 | 804 | 635 | 586 | 957 | 914 |
| 2013 | 996 | 803 | 964 | 1,015 | 1,027 | 1,024 | 1,155 | 1,048 | 701 | 957 | 1,149 | 1,021 |
| 2014 | 1,244 | 1,121 | 848 | 884 | 1,239 | 1,170 | 1,198 | 1,034 | 947 | 951 | 1,166 | 1,455 |
| 2015 | 1,610 | 1,476 | 1,061 | 1,079 | 1,025 | 1,391 | 1,248 | 1,134 | 894 | 1,352 | 1,404 | 1,381 |
| 2016 | 1,572 | 1,388 | 1,060 | 1,140 | 1,317 | 1,657 | 1,603 | 1,474 | 1,239 | 1,500 | 1,390 | 1,579 |
| 2017 | 1,560 | 1,474 | 1,067 | 1,332 | 1,554 | 1,189 | 1,322 | 1,106 | 1,491 | 1,561 | 1,417 | 1,225 |
| 2018 | 1,415 | 904 | 1,013 | 1,465 | 1,499 | 1,285 | 1,487 | 1,618 | 1,802 | 1,258 | 1,420 | 1,424 |
| 2019 | 1,543 | 1,196 | 1,089 | 1,015 | 1,365 | 1,192 | 1,124 | 1,273 | 1,158 | 1,281 | 1,163 | 1,360 |
| 2020 | 1,209 | 963 | 1,326 | 1,150 | 1,414 | 1,422 | 1,545 | 1,239 | 1,238 | 1,227 | 1,444 | 1,680 |
| 2021 | 1,491 | 1,151 | 1,060 | 1,145 | 1,484 | 1,345 | 1,322 | 1,207 | 1,396 | 1,084 | 1,339 | 1,586 |
| 2022 | 1,598 | 1,148 | 1,262 | 905 | 1,208 | 1,178 | 1,089 | 1,103 | 1,300 | 1,192 | 1,142 | 1,198 |
| 2023 | 1,256 | 1,318 | 830 | 965 | 1,159 | 1,129 | 1,066 | 1,224 | 1,069 | 1,166 | 1,079 | 1,243 |
| 2024 | 1,403 | |||||||||||
| - = No Data Reported; -- = Not Applicable; NA = Not Available; W = Withheld to avoid disclosure of individual company data. |
| Release Date: 3/29/2024 |
| Next Release Date: 4/30/2024 |