|
Download Data (XLS File) |
|
||||||||
|
||||||||
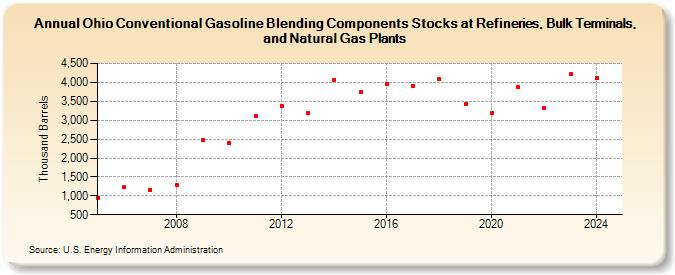
| Ohio Conventional Gasoline Blending Components Stocks at Refineries, Bulk Terminals, and Natural Gas Plants (Thousand Barrels) | ||||||||
| Decade | Year-0 | Year-1 | Year-2 | Year-3 | Year-4 | Year-5 | Year-6 | Year-7 | Year-8 | Year-9 |
|---|---|---|---|---|---|---|---|---|---|---|
| 2000's | 943 | 1,226 | 1,154 | 1,289 | 2,483 | |||||
| 2010's | 2,400 | 3,117 | 3,387 | 3,199 | 4,071 | 3,737 | 3,948 | 3,911 | 4,077 | 3,426 |
| 2020's | 3,185 | 3,870 | 3,317 | 4,224 |
| - = No Data Reported; -- = Not Applicable; NA = Not Available; W = Withheld to avoid disclosure of individual company data. |
| Release Date: 8/30/2024 |
| Next Release Date: 8/29/2025 |