|
Download Data (XLS File) |
|
||||||||
|
||||||||
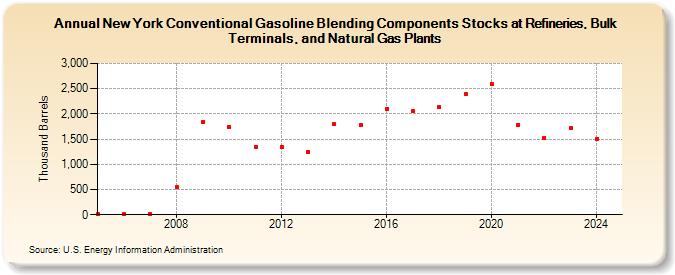
| New York Conventional Gasoline Blending Components Stocks at Refineries, Bulk Terminals, and Natural Gas Plants (Thousand Barrels) | ||||||||
| Decade | Year-0 | Year-1 | Year-2 | Year-3 | Year-4 | Year-5 | Year-6 | Year-7 | Year-8 | Year-9 |
|---|---|---|---|---|---|---|---|---|---|---|
| 2000's | 19 | 5 | 8 | 553 | 1,836 | |||||
| 2010's | 1,743 | 1,349 | 1,352 | 1,246 | 1,794 | 1,776 | 2,103 | 2,049 | 2,128 | 2,389 |
| 2020's | 2,586 | 1,788 | 1,522 | 1,715 |
| - = No Data Reported; -- = Not Applicable; NA = Not Available; W = Withheld to avoid disclosure of individual company data. |
| Release Date: 3/29/2024 |
| Next Release Date: 8/30/2024 |