|
Download Data (XLS File) |
|
||||||||
|
||||||||
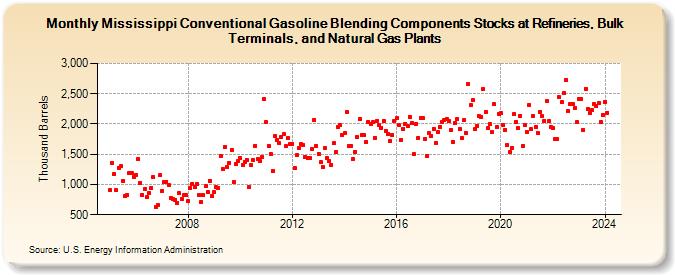
| Mississippi Conventional Gasoline Blending Components Stocks at Refineries, Bulk Terminals, and Natural Gas Plants (Thousand Barrels) | ||||||||
| Year | Jan | Feb | Mar | Apr | May | Jun | Jul | Aug | Sep | Oct | Nov | Dec |
|---|---|---|---|---|---|---|---|---|---|---|---|---|
| 2005 | 910 | 1,358 | 1,166 | 901 | 1,279 | 1,301 | 1,064 | 811 | 825 | 1,188 | 1,185 | 1,126 |
| 2006 | 1,160 | 1,424 | 1,027 | 829 | 927 | 786 | 861 | 947 | 1,126 | 623 | 663 | 1,155 |
| 2007 | 892 | 1,047 | 1,046 | 987 | 782 | 759 | 749 | 699 | 852 | 761 | 819 | 826 |
| 2008 | 730 | 944 | 1,014 | 965 | 1,005 | 828 | 710 | 821 | 967 | 876 | 1,062 | 806 |
| 2009 | 872 | 951 | 949 | 1,466 | 1,259 | 1,622 | 1,289 | 1,361 | 1,575 | 1,040 | 1,336 | 1,391 |
| 2010 | 1,430 | 1,330 | 1,375 | 1,409 | 955 | 1,321 | 1,397 | 1,643 | 1,420 | 1,384 | 1,451 | 2,406 |
| 2011 | 2,025 | 1,642 | 1,502 | 1,226 | 1,801 | 1,734 | 1,678 | 1,791 | 1,833 | 1,634 | 1,772 | 1,672 |
| 2012 | 1,676 | 1,273 | 1,486 | 1,601 | 1,676 | 1,660 | 1,447 | 1,433 | 1,432 | 1,586 | 2,071 | 1,636 |
| 2013 | 1,509 | 1,365 | 1,281 | 1,598 | 1,432 | 1,386 | 1,324 | 1,680 | 1,540 | 1,954 | 1,976 | 1,817 |
| 2014 | 1,845 | 2,201 | 1,635 | 1,634 | 1,420 | 1,541 | 1,778 | 2,080 | 1,820 | 1,818 | 1,702 | 2,037 |
| 2015 | 2,007 | 2,025 | 1,774 | 2,055 | 1,977 | 1,937 | 2,055 | 1,887 | 1,834 | 1,713 | 1,818 | 2,056 |
| 2016 | 2,095 | 1,978 | 1,740 | 1,923 | 2,005 | 1,971 | 2,116 | 2,009 | 1,496 | 2,001 | 1,773 | 2,100 |
| 2017 | 2,093 | 1,752 | 1,473 | 1,847 | 1,801 | 1,918 | 1,686 | 1,860 | 1,957 | 2,040 | 2,062 | 2,084 |
| 2018 | 2,048 | 1,894 | 1,706 | 2,017 | 2,083 | 1,925 | 1,771 | 2,065 | 1,852 | 2,653 | 2,310 | 2,393 |
| 2019 | 1,912 | 1,973 | 2,134 | 2,120 | 2,575 | 2,206 | 1,928 | 1,996 | 1,869 | 2,322 | 1,953 | 2,168 |
| 2020 | 2,181 | 1,981 | 1,905 | 1,652 | 1,529 | 1,611 | 2,157 | 2,040 | 1,932 | 2,133 | 1,638 | 1,985 |
| 2021 | 1,865 | 2,321 | 1,911 | 2,139 | 1,951 | 1,857 | 2,203 | 2,124 | 2,055 | 2,374 | 2,047 | 1,948 |
| 2022 | 1,933 | 1,748 | 1,749 | 2,438 | 2,355 | 2,512 | 2,733 | 2,213 | 2,328 | 2,336 | 2,272 | 2,028 |
| 2023 | 2,413 | 2,413 | 1,904 | 2,584 | 2,248 | 2,182 | 2,224 | 2,331 | 2,289 | 2,344 | 2,035 | 2,156 |
| 2024 | 2,368 | |||||||||||
| - = No Data Reported; -- = Not Applicable; NA = Not Available; W = Withheld to avoid disclosure of individual company data. |
| Release Date: 3/29/2024 |
| Next Release Date: 4/30/2024 |