|
Download Data (XLS File) |
|
||||||||
|
||||||||
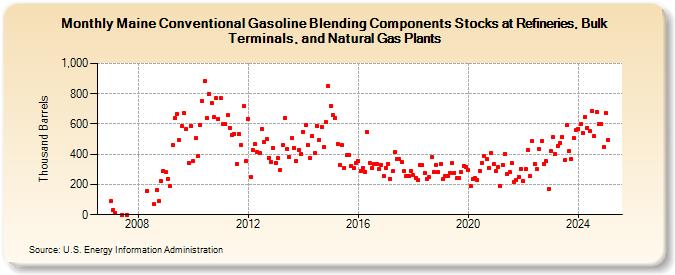
| Maine Conventional Gasoline Blending Components Stocks at Refineries, Bulk Terminals, and Natural Gas Plants (Thousand Barrels) | ||||||||
| Year | Jan | Feb | Mar | Apr | May | Jun | Jul | Aug | Sep | Oct | Nov | Dec |
|---|---|---|---|---|---|---|---|---|---|---|---|---|
| 2007 | 88 | 30 | 13 | 1 | 1 | |||||||
| 2008 | 159 | 69 | 163 | 89 | 222 | 290 | ||||||
| 2009 | 282 | 239 | 189 | 462 | 637 | 666 | 493 | 586 | 672 | 567 | 340 | 587 |
| 2010 | 354 | 504 | 388 | 593 | 751 | 883 | 639 | 800 | 741 | 643 | 769 | 634 |
| 2011 | 771 | 597 | 597 | 657 | 575 | 525 | 536 | 336 | 534 | 460 | 716 | 354 |
| 2012 | 635 | 247 | 428 | 466 | 412 | 406 | 569 | 483 | 500 | 377 | 349 | 444 |
| 2013 | 344 | 374 | 297 | 458 | 640 | 435 | 379 | 507 | 442 | 356 | 425 | 399 |
| 2014 | 549 | 591 | 460 | 376 | 520 | 408 | 585 | 495 | 580 | 448 | 610 | 849 |
| 2015 | 721 | 659 | 641 | 469 | 331 | 459 | 310 | 393 | 392 | 325 | 308 | 344 |
| 2016 | 358 | 291 | 310 | 283 | 544 | 344 | 306 | 338 | 334 | 300 | 329 | 253 |
| 2017 | 311 | 334 | 239 | 286 | 412 | 367 | 366 | 346 | 287 | 258 | 253 | 290 |
| 2018 | 261 | 242 | 231 | 326 | 330 | 278 | 236 | 247 | 383 | 282 | 330 | 282 |
| 2019 | 336 | 234 | 257 | 255 | 279 | 340 | 278 | 240 | 240 | 280 | 325 | 316 |
| 2020 | 294 | 187 | 235 | 240 | 231 | 290 | 342 | 386 | 367 | 312 | 408 | 335 |
| 2021 | 287 | 313 | 192 | 331 | 403 | 268 | 283 | 340 | 218 | 230 | 250 | 305 |
| 2022 | 220 | 303 | 428 | 259 | 485 | 336 | 301 | 433 | 488 | 336 | 353 | 171 |
| 2023 | 497 | 315 | 401 | 457 | 474 | 514 | 361 | 590 | 421 | 370 | 505 | 559 |
| 2024 | 566 | |||||||||||
| - = No Data Reported; -- = Not Applicable; NA = Not Available; W = Withheld to avoid disclosure of individual company data. |
| Release Date: 3/29/2024 |
| Next Release Date: 4/30/2024 |