|
Download Data (XLS File) |
|
||||||||
|
||||||||
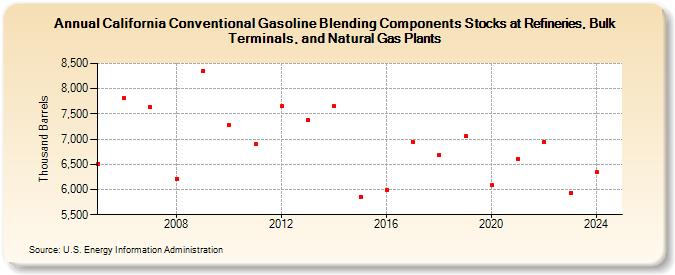
| California Conventional Gasoline Blending Components Stocks at Refineries, Bulk Terminals, and Natural Gas Plants (Thousand Barrels) | ||||||||
| Decade | Year-0 | Year-1 | Year-2 | Year-3 | Year-4 | Year-5 | Year-6 | Year-7 | Year-8 | Year-9 |
|---|---|---|---|---|---|---|---|---|---|---|
| 2000's | 6,497 | 7,814 | 7,639 | 6,218 | 8,348 | |||||
| 2010's | 7,273 | 6,901 | 7,656 | 7,380 | 7,656 | 5,858 | 5,986 | 6,948 | 6,683 | 7,057 |
| 2020's | 6,087 | 6,607 | 6,949 | 5,927 |
| - = No Data Reported; -- = Not Applicable; NA = Not Available; W = Withheld to avoid disclosure of individual company data. |
| Release Date: 3/29/2024 |
| Next Release Date: 8/30/2024 |